Abstract
Between 1985 and 2002, homeownership and housing affordability in Hong Kong greatly increased, due to a large expansion of subsidised homeownership. However, since 2002, homeownership and housing affordability have fallen, in large part due to the Government’s retreat from subsidising homeownership. Private-sector rents are now highly unaffordable for the median-income household. Means-tested public rental housing is the only affordable option for a large majority of the population. This situation has created a strong incentive for the population to opt for lower-paying or part-time work, artificially reducing labour supply and human capital investment. Hong Kong must enact housing reforms, including a large expansion of its subsidised homeownership programme, to secure a better future for ensuing generations.
Introduction
Shortages of affordable housing are contributing to socioeconomic inequality and hindering productivity growth in many urban centres around the globe (Glaeser and Gyourko 2018; Hsieh and Moretti 2019; Dustmann, Fitzenberger and Zimmermann 2022; Baum-Snow 2023). Hong Kong is a leading example, having been consecutively ranked the least affordable housing market in the world for the past fifteen years (Demographia 2025). In this article, we quantify the trends in housing affordability, homeownership, and housing assistance provision in Hong Kong between 1985 and 2023. We bring together individual-level microdata from 152 waves of the General Household Survey with rent, price, and construction datasets to assess how the city’s housing policy has mediated these trends. We document that prior to the major repositioning of housing policy in 2002, homeownership and affordability were on the rise, driven largely by a major expansion of subsidised homeownership. However, after 2002, homeownership and affordability fell, in particular for later birth cohorts, in part due to the retreat of the government from promoting subsidised homeownership. The dramatic reductions in youth homeownership and housing affordability have yet to be reversed.
Housing construction, especially of subsidised ownership units, remains much lower than the levels prior to 2002. The supply of subsidised ownership units is also deeply depressed relative to demand. There is a very wide gap between public-and private-sector rental prices. Private-sector rents for small units in more remote areas are unaffordable for the median-income household, leaving public rental housing as the only affordable option for a large majority of the population. These trends explain a growing sentiment among local youth: that reducing labour supply to successfully obtain public rental housing represents their best opportunity to “win” in life. Hong Kong must enact housing reforms, including a large expansion of its subsidised homeownership programmes, to secure a better future for its upcoming generations.
Figure 1: Trend in Completion of Housing Units

Figure 1 shows the trend in domestic housing units completed in Hong Kong from 1985 to 2024, based on data compiled by the Census and Statistics Department. The production of Home Ownership Scheme flats (HOS) was suspended in November 2002. Completed HOS flats have since been recorded as housing production based on their actual use at the time of disposal, rather than their original classification at completion.
Background: A Brief History of Hong Kong Housing Policy
Hong Kong’s public housing system originated in the 1950s to resettle a large population of refugees living in squatter settlements. In the aftermath of the 1967 riots, Governor Murray MacLehose launched an ambitious urban development programme in 1972 aimed at addressing widespread housing shortages and social discontent. This initiative included the development of rural areas into “New Towns” and a major expansion of the Public Rental Housing (PRH) programme, which provided subsidised rental accommodation. Around the same period, the Home Ownership Scheme (HOS) was introduced to promote subsidised homeownership and broaden access to affordable housing.
The Government’s aggressive expansion of public housing lasted through the 1980s and 1990s. The 1987 Long Term Housing Strategy (LTHS) aimed to provide an annual average of 72,333 domestic housing units, encompassing both public and private sector supply. Following the 1997 handover, the Government conducted a public consultation and subsequently launched a revised LTHS in 1998, which raised the housing supply target to no fewer than 85,000 units per year.
However, the Government repositioned its housing policy in 2002, after the 1998 Asian Financial Crisis precipitated a severe recession and a sharp decline in property prices. Land auctions were halted and the HOS was suspended in an effort to stabilise the property market.
Figure 2: Annual probability of HOS White Form Lottery Win

Figure 2 plots the HOS White Form lottery winning probability from 1985 to 2024 based on data from the Hong Kong Housing Authority. For years with multiple HOS sales schemes, we assume that the same applicant applies for each scheme, and calculate the lottery winning probability as the combined probability of winning at least once in that year. For years without any HOS sale, the probability is assigned as 0%.
Figure 1 shows the trend in unit completions between 1985 and 2024. Between 1985 and 2002, an annual average of around 64,800 public and private units was completed. Between 2003 and 2023, housing completions were much lower, averaging around 30,900 units per year. The construction of HOS units was almost entirely suspended, with only 6,010 units completed between 2002 and 2016.
Figure 2 shows the trend in lottery-winning probabilities for White Form applicants under the HOS. These refer to non-PRH residents who are eligible to apply for subsidised housing. Since the number of applicants has typically exceeded the available supply, allocation is determined through a lottery system. During 1985-2002, the average winning probability for White Form applicants was 17%. During 2003-2023, after the 2002 housing policy repositioning, winning probabilities averaged only 3%.
The Government’s housing supply target remains depressed today. According to the 2025 LTHS Annual Progress Report, the Government has set a 10-year housing supply target of 420,000 units for the period 2026/27 to 2035/36. Of these, 294,000 units (70%) are designated for public housing, and 126,000 units (30%) for private housing, equivalent to an average annual supply of about 42,000 units. Although this planned output is roughly 22% higher than that of the previous decade, it is still much lower than the 1985–2002 levels.
Homeownership and Housing Assistance Provision
In this section, we document the trends in homeownership and housing assistance provision. To do so, we draw on individual-level microdata from the General Household Survey (GHS), spanning 1985 to 2023. Although the GHS is primarily used to monitor labour market trends, it is suitable for historical housing research for two key reasons. First, it is a high-frequency, representative, and historically comprehensive dataset, collected quarterly by the Census and Statistics Department since the first wave conducted in 1981. Second, it contains detailed variables on both housing type and demographic characteristics.
We classify Hong Kong’s housing stock into four tenure types:
- Public renters live in PRH units, which are owned and managed by the Hong Kong Housing Authority and the Hong Kong Housing Society. As of 2024, 30% of households resided in around 866,000 PRH units. Each of these units typically range between 300 and 400 square feet in size. Applicants must satisfy specific income and asset eligibility criteria. Allocations are generally made on a first-come, first-served basis through a central waiting list. Existing tenants are subject to periodic means testing, and those whose income exceeds the prescribed thresholds are required to pay 2.5 to 4.5 times the base rent under the latest Well-off Tenant Policy. Adjustments to nominal rents are linked to overall income growth and are capped at 10% every two years.
- Public owners live in subsidised homeownership units. As of 2024, 15.4% of households lived in about 454,000 such units across Hong Kong. The majority of these households occupy HOS flats, which typically range from 500 to 700 square feet each. They are sold at 30–50% below market value. Allocation is conducted through a lottery system open to eligible applicants who meet specific income and asset criteria. Another segment of public owners resides in Tenant Purchase Scheme (TPS) flats—former PRH units sold to sitting PRH tenants at substantial discounts between 1998 and 2006. To obtain the right to resell or lease their units on the private market, owners of subsidised flats must repay the original discount at current market value. Once this repayment is made, they are reclassified as private homeowners.
- Private owners purchase their homes directly from private-sector developers. As of 2024, 35.3% of households in Hong Kong owned private housing units.
- Private renters rent directly from private-sector owners. They accounted for 18.5% of households as of 2024.
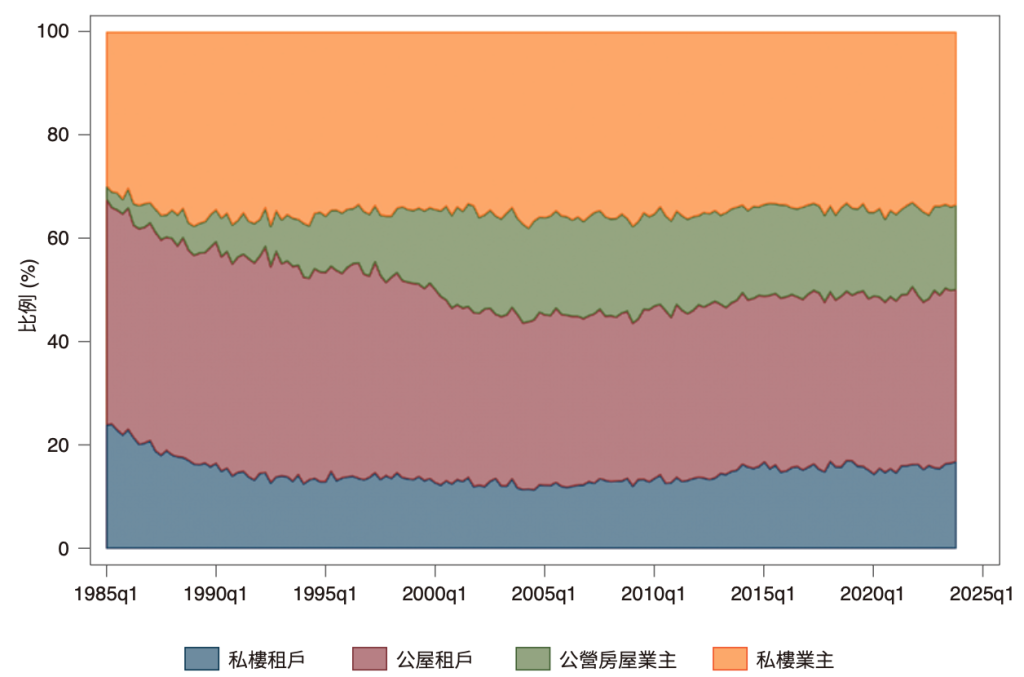
Figure 3 plots the trends in housing tenure shares among working-age adults in Hong Kong from 1985 to 2023, using quarterly data from the GHS.
As shown in Figure 3, the 1985-2002 period was characterised by rapid growth of subsidised homeownership. The share of public owners increased from 2.9% in 1985 to 18.7% in 2002
Figure 3: Housing Tenure Shares over Time
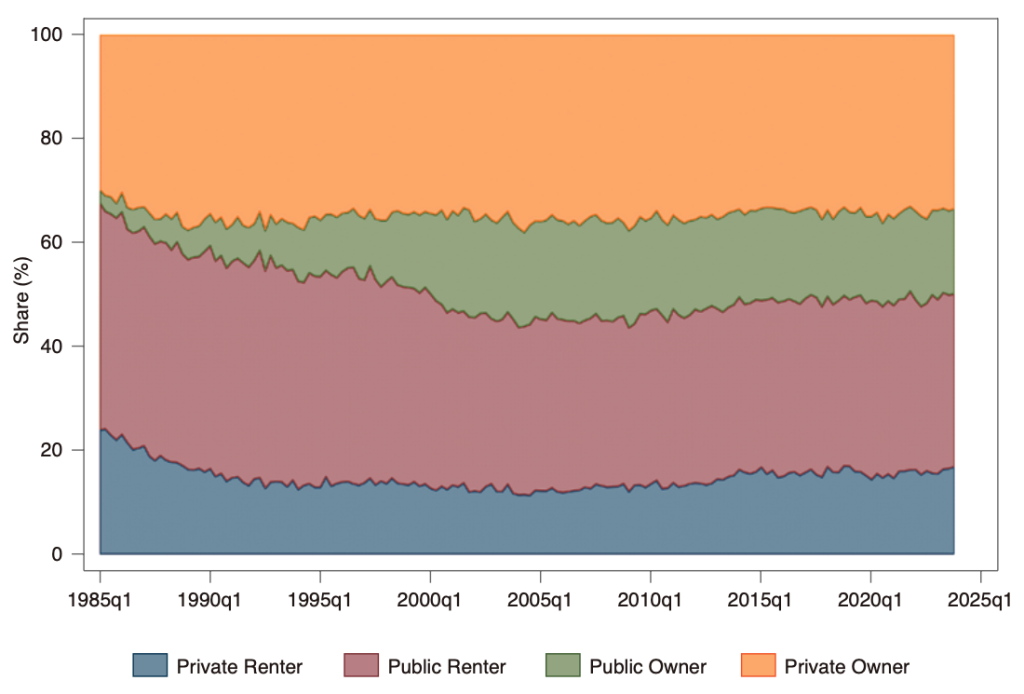
Figure 3 shows the trend in the shares of individuals aged 20+ in each housing tenure type, between 1985 and 2023. Data are from the Hong Kong General Household Survey.
(around 16 percentage points, or p.p.). The private owner share increased more modestly, from 31.1% in 1985 to 35.4% in 2002 (around +4 p.p.). Overall, homeownership rates increased from 34.0% in 1985 to 54.1% in 2002 (around +20 p.p.). These shifts reflect the Government’s aggressive promotion of homeownership through the expansion of the HOS and TPS.
As homeownership rose, renter shares fell correspondingly. The drop in total renter share was accounted for by similar declines in the public and private sectors. Private renter shares declined from 23.2% in 1985 to 12.7% in 2002 (around -11 p.p.). Public renter shares also contracted from 42.7% in 1985 to 33.2% in 2002 (around -10 p.p.).
During 2002-2023, the increases in homeownership stalled and began to fall instead. The public owner share fell from 18.7% in 2002 to 16.5% in 2023 (-2.2 p.p.). The drop in private owner share was more modest, from 35.4% in 2002 to 33.6% in 2023 (-1.8 p.p.). Overall, homeownership rates decreased from 54.1% in 2002 to 50.1% in 2023 (-4 p.p.).
The decline in homeownership coincided with an increase in renter shares. The rise in renter share was entirely accounted for by the expansion in private renter. The share of this segment increased from 12.7% in 2002 to 16.3% in 2023, largely matching the gain in overall renter shares from 45.9% to 49.8% in the same period. In comparison, the public renter share rose slightly from 33.2% in 2002 to 33.5% in 2023.
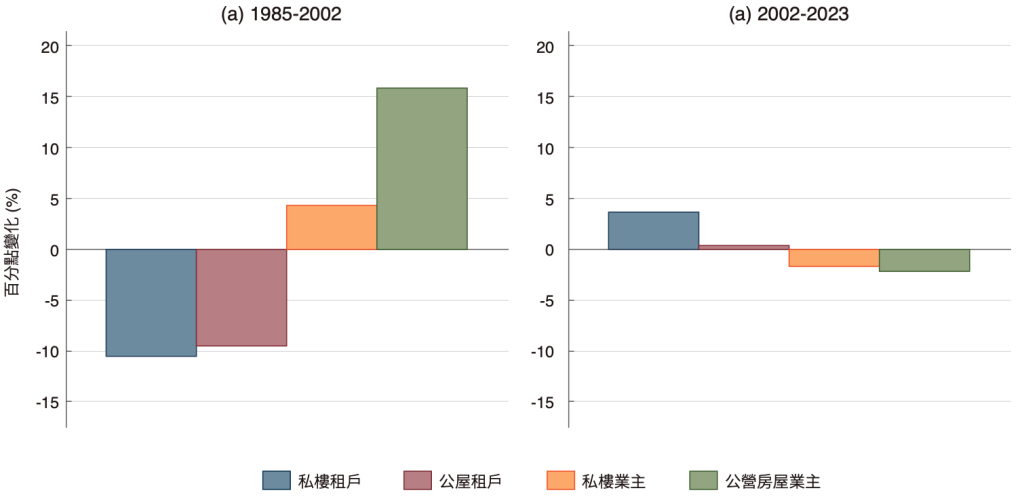
Figure 4 summarises the changes in housing tenure shares in two periods: 1985-2002 and 2002-2023; confirming a dramatic reversal in the evolution of Hong Kong’s housing system. The earlier period was marked by a massive expansion of homeownership, and the later period by a mild contraction of homeownership.
Figure 4: Change in Housing Tenure Shares
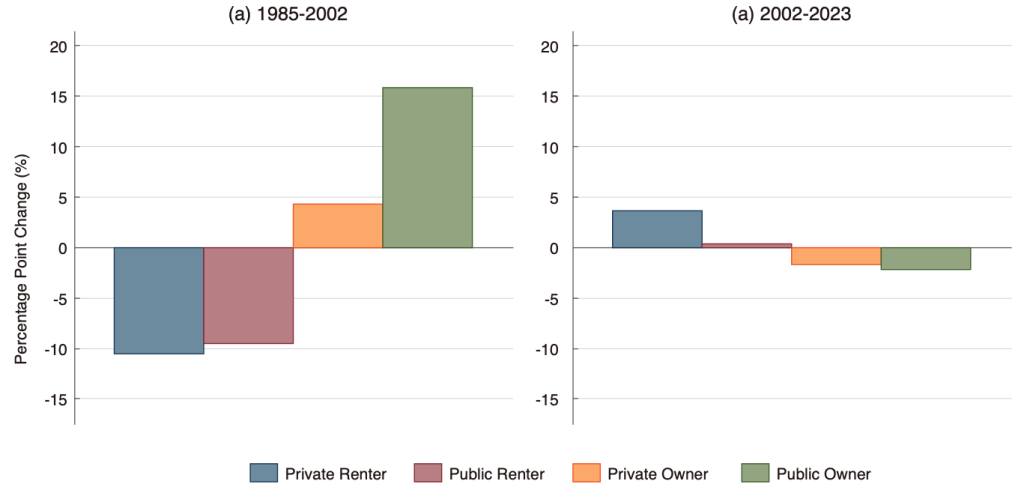
Figure 4 shows the percentage-point changes in housing tenure shares in Hong Kong between two periods: (a) 1985-2002 and (b) 2002-2023. Data are from the Hong Kong General Household Survey. The sample includes all working-age individuals (aged 20+).
As shown in Figure 4, the 1985-2002 period was dominated by subsidised homeownership expansion. Public ownership surged by 15.8 p.p.—nearly four times the 4.3 p.p. gain in private ownership—demonstrating that Government programmes, rather than private market purchases, drove the homeownership boom. These gains drew roughly equally from both rental sectors, which declined by approximately 10 p.p. each.
During 2002-2023, these trends reversed: Homeownership contracted—the public owner share by 2.2 p.p. and the private owner share by 1.8 p.p.—while the total rental share expanded by 4 p.p., driven by increases in private rental (+3.6 p.p.). This period marked the end of sustained homeownership growth and the rise of private renting as the tenure option for working-age adults.
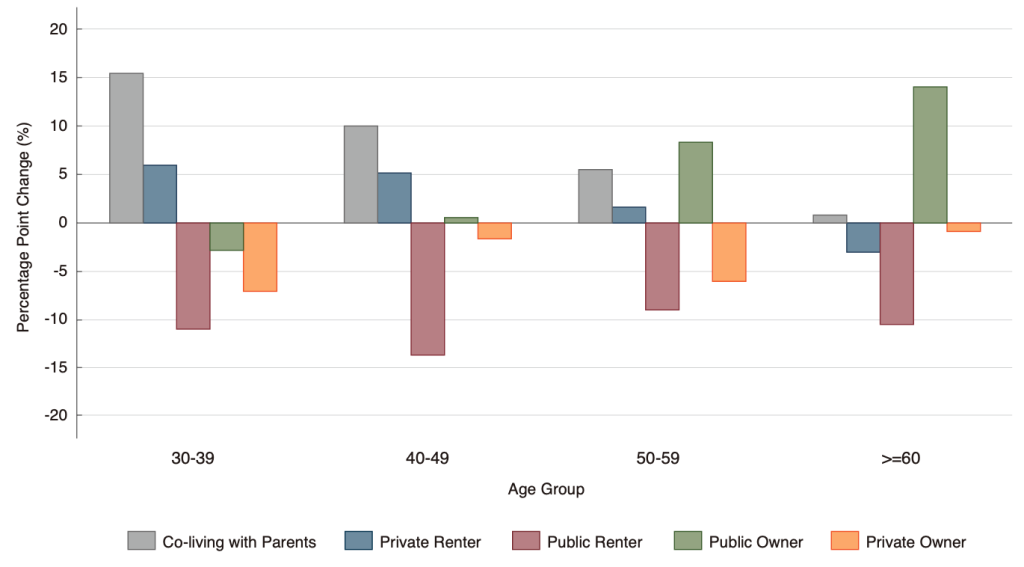
Figure 5 shows the trends in housing tenure shares by age group in Hong Kong from 1993 to 2023. Individuals who live with their parents are classified as a separate and mutually exclusive category alongside the four independent housing tenure categories (private renter, public renter, private owner, and public owner). The figure reveals substantial generational differences in access to public housing assistance: younger cohorts experiencing declining housing assistance over time while older groups have maintained their access to subsidised housing.
Figure 5: Housing Tenure Shares by Age Group

Notes: This figure shows the evolution of housing tenure composition in Hong Kong from 1993 to 2023 by age group, using stacked area representation. Data are from the Hong Kong General Household Survey.
For the 30-39 age group, public housing assistance contracted sharply between 1993 and 2023. The public renter share declined from 20.9% to 9.9% (-11 p.p.), while the public owner share fell from 9.1% to 6.2% (around -3 p.p.). Overall, total public housing access declined from 30.1% to 16.1% (-14 p.p.). Private ownership also fell dramatically, declining from 30.7% to 23.4% (around -7 p.p.). As access to both public housing and private ownership diminished, younger adults increasingly relied on two alternatives: the private renter share rose from 14.1% in 1993 to 20.0% in 2023 (around +6 p.p.), while the co-living share increased from 25.1% in 1993 to 40.5% in 2023 (around +15 p.p.).
The 40-49 age group exhibited similar patterns of declining housing assistance between 1993 and 2023. The public renter share contracted from 34.7% to 20.9% (around -14 p.p.), while the public owner share increased only marginally from 7.7% to 8.1% (+0.4 p.p.). Overall, total public housing access declined from 42.4% to 29.0% (around -13 p.p.). Private ownership declined modestly from 30.5% to 28.8% (around -2 p.p.). The private renter share increased from 14.9% to 20.0% (around +5 p.p.), while co-living with parents rose from 12.1% to 22.1% (+10 p.p.).
For the 50-59 age group, the decline in public renting between 1993 and 2023 was substantially offset by gains in public ownership. The public renter share fell from 38.3% to 29.1% (around -9 p.p.), but the public owner share increased from 5.9% to 14.2% (around +8 p.p.). Overall, total public housing access remained relatively stable, declining only slightly from 44.2% to 43.3% (around -1 p.p.). Private ownership declined from 36.2% to 30.0% (around -6 p.p.), while the private renter share increased slightly from 13.4% to 14.9% (around +2 p.p.).
The 60+ age group enjoyed the most from the expansion in public housing between 1993 and 2023. The public renter share declined from 46.1% to 35.6% (around -10 p.p.), but the public owner share increased substantially from 7.1% to 21.0% (around +14 p.p.). Overall, total public housing access increased from 53.2% to 56.6% (around +3 p.p.). Private ownership remained relatively stable, declining slightly from 35.2% to 34.2% (-1 p.p.).
Figure 6: Change in Housing Tenure Shares by Age Group
Notes: This figure shows the percentage point changes in housing tenure shares by age group in Hong Kong between 1993 and 2023. Data are from the Hong Kong General Household Survey.
Figure 6 summarizes the changes in housing tenure shares by age group between 1993 and 2023, confirming a dramatic generational divide in housing opportunities. Younger age cohorts increasingly rely on parental co-residence and private rental markets. For the 30-39 age group, co-living with parents surged by around 15 p.p.—the largest increase across all categories—while private renting rose by approximately 6 p.p.. These increases coincided with declining access to subsidised housing and homeownership: public renting fell by approximately 11 p.p., private ownership declined by around 7 p.p., and public ownership dropped by around 3 p.p.. The 40-49 age group exhibited similar patterns.
In contrast, older age cohorts, particularly those 60+, benefited from expanding access to subsidised homeownership. The 50-59 age group saw public ownership increase by approximately 8 p.p., partially offsetting declines in public renting (around 9 p.p.) and private ownership (around 6 p.p.). The 60+ age group experienced a large increase in public ownership (of about 14 p.p.), which fully offset the decline in public renting and private ownership combined (around 11 p.p.), suggesting successful transitions from public renting to subsidised homeownership.
Figure 7 presents the evolution of housing shares by age group across different generations in Hong Kong, tracking 10-year cohorts from the 1940s through the 1990s. The figures reveal a stark generational divide in housing shares, with more recent cohorts experiencing systematically lower rates of homeownership and public housing access throughout their lives compared to earlier generations.
Figure 7: Housing Tenure Share by Birth Cohort and Age Group

Figure 7 shows the life-cycle housing tenure profiles by birth cohort in Hong Kong from 1993 to 2023. Data are from the Hong Kong General Household Survey. The sample includes working-age individuals (20-59). Individuals living with parents are excluded from the four tenure categories shown. Missing data points indicate cohorts not observed at those ages during the survey period.
Private ownership is much lower for younger birth cohorts. The 1960-69 and 1970-79 cohorts achieved 28.4% and 27.5%, private ownership respectively at ages 30-34. However, more recent cohorts show markedly lower rates at comparable ages. By ages 30-34, the 1980-89 cohort achieved just 22.5% and the 1990-99 cohort reached only 19.8%. These declining trajectories indicate that younger generations cannot afford to buy homes at the same life stages as earlier generations did.
Instead of buying, younger birth cohorts increasingly rent in the private market during their early working years. At ages 35-39, 14.8% of the 1950-59 cohort were private renters and 15.8% of the 1960-69 cohort were private renters at the same age. However, for the 1970-1979 and 1980-89 cohorts, the shares increased to 20.5% and 21.1% respectively, around 5 p.p. higher than earlier cohorts. The share of private renters for the 1970-1979 cohort was also consistently higher than that for earlier cohorts at older ages.
For younger cohorts, public ownership has also fallen. At ages 30-34, the 1960-69 cohort had achieved 10.1% public ownership, and the 1970-79 cohort 8.3%. In contrast, at ages 30-34, the 1980-89 cohort achieved just 5.7% and the 1990-99 cohort reached only 4.8%. This trend continued through ages 35-39 and 40-44, reflecting the Government’s scaling back of subsidised homeownership programmes after 2002.
Public rental declined for younger cohorts. At ages 25-29, the 1960-69 cohort had 8.5% in public renting, while the 1970-79 cohort had 6.6% at the same age. In contrast, the 1980-89 cohort had only approximately 5.1% at ages 25-29, and the 1990-99 cohort just 3.7%.
Overall, younger cohorts have much lower access to public housing in early adulthood. This is likely in large part driven by slow construction of public housing. The consequence is greater difficulty for younger cohorts to achieve housing independence.
Housing Affordability
The previous section documented that younger cohorts in Hong Kong are experiencing reduced homeownership and greater reliance on private renting. This section examines the trends in rental and ownership housing affordability in Hong Kong from 1985 to 2024.
Rental affordability
Rental affordability is measured using the rent-to-income ratio (RIR) for median-income households renting a typical 400-sq-ft unit. This indicator measures the share of household income devoted to rent payments. This indicator is widely used internationally. According to the UN-Habitat and World Bank, housing is considered affordable when housing expenditures account for less than 30% of household income, while levels above this threshold indicate unaffordability.
Between 1985 and 1990, private rental housing became increasingly unaffordable for median-income households across all regions of Hong Kong. As shown in Figure 8, the RIR for a typical 400-sq-ft private unit rose from 55% to 59% on Hong Kong Island (+4 p.p.), from 59% to 65% in Kowloon (+6 p.p.), and from 43% to 46% in the New Territories (+3 p.p.). These increases represent a noticeable deterioration in rental affordability.
Between 1990 and 2003, private rental affordability improved. The RIR declined from 59% to 35% on Hong Kong Island (-24 p.p.) from 65% to 28% in Kowloon (-37 p.p.) and from 46% to 22% in the New Territories (-24 p.p.). RIR in New Territories averaged 28% between 1995-2003, below the commonly accepted affordability threshold, indicating sustained affordability benefits during this period.
Between 2003 and 2024, private rental affordability deteriorated sharply again across all regions. Particularly, on Hong Kong Island, the RIR increased sharply from 35% in 2003 to 60% in 2024 (+25 p.p.), peaking at 65% in both 2015 and 2019. In Kowloon, the RIR increased from 28% in 2003 to 53% in 2024 (+25 p.p.). In New Territories, the RIR rose from 22% to 41% (+19 p.p.), indicating a long-term shift back toward unaffordability.
Compared with similarly-sized private units, public housing rents are dramatically more affordable. For median-income households, public housing rents accounted for approximately 7%-11% of household income between 1985 and 2024.
Homeownership affordability
Homeownership affordability is measured using the median multiple, defined here as the median price of a 500-sq-ft unit divided by median household income. This indicator is widely recognised and adopted by international organizations, including the World Bank, the United Nations, the Organisation for Economic Co-operation and Development (OECD), and Demographia. Following Demographia’s (2025) classification, this study adopts its framework as the standard benchmark for cross-national housing
Figure 8: Monthly Burden of Median-Income Households for Renting a 400 sq ft Unit

Figure 8 presents the trends of monthly rental burden (rent-to-income ratio) for median-income households renting a 400 sq ft unit, between 1985 and 2024. Data derived from the Census and Statistics Department, Rating and Valuation Department and Housing Authority. Due to definitional differences in district boundaries, data for Kowloon between 1985 and 1989 do not cover all areas within the district.
affordability comparison. Under this classification, a median multiple of ≤3.0 indicates an affordable housing market, 3.1-4.0 is moderately unaffordable, 4.1-5.0 is seriously unaffordable, 5.1-8.9 is severely unaffordable, and 9.0 or above is deemed impossibly unaffordable.
Between 1985 and 1997, Hong Kong’s private ownership market was largely unaffordable across all regions. As shown in Figure 9, the median multiple for a standard 500-sq-ft private unit rose from 6.7 to 16.9 years on Hong Kong Island (+152%) and from 5.2 to 11.1 years in Kowloon (+113%). In the New Territories, it increased from 5.6 to 12.2 years between 1987 and 1997. These large increases indicate a substantial deterioration in homeownership affordability. According to Demographia’s benchmark, the market shifted from severely unaffordable to impossibly unaffordable by the mid-1990s.
Between 1997 and 2003, private ownership affordability improved significantly following a sharp fall in housing prices. The median multiple dropped from 16.9 to 7.4 years on Hong Kong Island (−56%), from 11.1 to 5.3 years in Kowloon (−52%), and from 12.2 to 5.2 years in the New Territories (−57%). By 2003, homeownership affordability had returned to near 1980s levels.
Between 2004 and 2024, private ownership affordability worsened dramatically again. The median multiple exceeded its 1997 peak in all regions after 2010 on Hong Kong Island and Kowloon, and after 2013 in New Territories. By 2024, it had risen from 7.4 to 18.2 years on Hong Kong Island (+146%), from 5.3 to 16.3 years in Kowloon (+209%) and from 5.2 to 14.0 years in New Territories (+169%). All regions have once again fallen into the impossibly unaffordable category, with affordability conditions worse than in the 1990s.
Figure 9: Years of Median Household Income Required to Purchase a 500 sq ft Unit
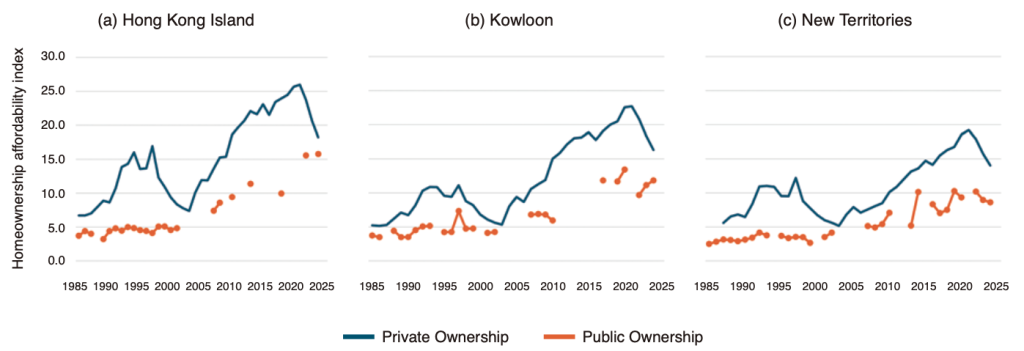
Notes: Figure 9 presents the trend in the years of median household income required to purchase a 500 sq ft unit, between 1985 and 2024. Data are derived from the Rating and Valuation Department and the Housing Authority. Due to definitional differences in district boundaries, data for Kowloon between 1985 and 1989 do not cover all areas within the district.
Compared with similarly-sized private units, public ownership remained substantially more affordable between 1985 and 2002. The median multiple for HOS units increased from 3.7 to 4.8 years on Hong Kong Island (+30%), from 3.7 to 4.2 years in Kowloon (+14%), and from 2.5 to 4.2 years in the New Territories (+68%). Affordability shifted from affordable to seriously unaffordable over this period, yet HOS units remained more affordable than private homeownership.
However, following the suspension of HOS production in 2002, public ownership affordability deteriorated too, mirroring private ownership trends. Between 2007 and 2024, the median multiple of HOS units increased from 7.4 to 15.8 years on Hong Kong Island (+114%), from 6.8 to 11.8 years in Kowloon (+74%), and from 5.1 to 8.6 years in the New Territories (+69%). Consequently, HOS units became severely to impossibly unaffordable on Hong Kong Island and in Kowloon, while the New Territories remained severely unaffordable.
The Shifting Housing Landscape for Young Adults
In this section, we summarise changes in housing tenure and housing affordability to understand how the housing landscape for young adults has shifted over the past three decades.
What did the housing market look like for young adults in 1993? Private homeownership accounted for 31% of individuals aged 30–39. As shown in Table 1, for private owners, a 500-sq-ft private-sector unit in Kowloon cost 10.9 years of median household income. Public ownership accounted for another 9%. For public owners, a 500-sq-ft HOS unit in Kowloon cost 5.1 years of median household income, and White Form wait times averaged roughly 8 years.[1] Public rental accounted for another 21% of this cohort. As shown in Table 2, for public renters, rent was only 8% of median household income. Private renters accounted for another 14% of the cohort. Private rental of
Table 1: Years of Median Household Income Needed to Purchase a Unit in Kowloon by Unit Size and Tenure Type
| Year | Public Ownership | Private Ownership | |||
| 500 sq ft | 500 sq ft | 900 sq ft | 1400 sq ft | 2100 sq ft | |
| 1985 | 3.7 | 5.2 | 11.6 | 18.3 | 22.3 |
| 1990 | 3.5 | 6.7 | 14.1 | 20.9 | 28.2 |
| 1995 | 4.2 | 9.6 | 21.6 | 32.1 | 44.6 |
| 2000 | – | 6.8 | 14.9 | 28.1 | 42.7 |
| 2005 | – | 9.4 | 24.6 | 49.5 | 65.5 |
| 2010 | 5.9 | 15.0 | 41.6 | 80.5 | 99.7 |
| 2015 | – | 18.9 | 41.9 | 73.0 | 90.2 |
| 2020 | 13.4 | 22.6 | 47.6 | 77.4 | 99.7 |
| 2024 | 11.8 | 16.3 | 37.1 | 64.0 | 71.8 |
Notes: Table 1 shows the trends in the number of years of median household income required to purchase units of different sizes in Kowloon in selected years. Data derived from the Rating and Valuation Department and Housing Authority. Due to definitional differences in district boundaries, data for Kowloon in 1985 do not cover all areas within the district. “-” indicates years with no HOS sales. Figures in bold indicate impossibly unaffordable, as defined according to international standards.
a 400-sq-ft unit in Kowloon required 58% of median household income. The remaining 25% lived with parents.
By 2002, homeownership and affordability for young adults both increased. Private homeownership accounted for 31.3% of individuals aged 30-39 (+1% from 1993). As shown in Table 1, for private owners, a 500-sq-ft private-sector unit in Kowloon cost 5.6 years of median household income (-48.6% from 1993). Public ownership now accounted for another 12.4% (+38% from 1993). For public owners, a 500-sq-ft HOS unit in Kowloon cost 4.2 years of median household income (-17.6% from 1993), and White Form wait times averaged
Table 2: Rental Burden for Median-Income Households in Kowloon by Unit Size and Tenure Type
| Year | Public renter | Private renter | |||
| 400 sq ft | 400 sq ft | 600 sq ft | 900 sq ft | 1400 sq ft | |
| 1985 | 11% | 59% | 73% | 122% | 173% |
| 1990 | 8% | 65% | 77% | 135% | 209% |
| 1995 | 8% | 55% | 76% | 127% | 209% |
| 2000 | 9% | 34% | 46% | 80% | 141% |
| 2005 | 12% | 33% | 51% | 101% | 167% |
| 2010 | 10% | 42% | 67% | 129% | 207% |
| 2015 | 9% | 52% | 73% | 120% | 183% |
| 2020 | 10% | 50% | 67% | 106% | 161% |
| 2024 | 10% | 53% | 67% | 103% | 155% |
Notes: Table 2 shows monthly rental burden (rent-to-income ratio) for median-income households renting units of different sizes in Kowloon in selected years. Data are compiled from the Rating and Valuation Department and the Hong Kong Housing Authority. Due to definitional differences in district boundaries, data for Kowloon in 1985 do not cover all areas within the district. Figures in bold indicate greater than 50%.
3.6 years.[2] Public rental accounted for another 13.7% of this cohort (-34.8% from 1993). As shown in Table 2, for public renters, rent was only 10% of median household income. Private renters accounted for another 15.8% of the cohort (-2% from 1993). Private rental of a 400-sq-ft unit in Kowloon required 29% of median household income (-50% from 1993). The remaining 26.7% lived with parents (+6.8% from 1993).
By 2023, homeownership and affordability for young adults dramatically declined. Private ownership accounted for 23.4% of individuals aged 30–39 (-25% from 2002). As shown in Table 1, for private owners, a 500-sq-ft private-sector unit cost 18.4 years of median household income (+229% from 2002). Public ownership accounted for another 6.2% (-50% from 2002). For public owners, a 500-sq-ft HOS unit in Kowloon cost 11.1 years of median household income (+163% from 2002), and White Form wait times averaged 25 years.[3] Public rental accounted for another 9.9% of this cohort (-38.4% from 2002). As shown in Table 2, for public renters, rent was only 10% of median household income. Private renters accounted for another 20.0% of the cohort (+26.6% from 2002). Private rental of a 400-sq-ft unit in Kowloon required 49% of median household income (+68.3% from 2002). The remaining 40.5% lived with parents (+49.8% from 2002).
These numbers indicate that private-sector housing of even basic quality has become impossibly unaffordable for the median household in Hong Kong. For the vast majority of Hong Kong residents, the only affordable option available is to obtain public rental units. Unsurprisingly, a prevalent sentiment among young people today is to view obtaining public rental units as “winning in life.” Anecdotes abound that young people are strategically taking on low-paying or part-time employment to meet the eligibility criteria for public housing. While such behaviour constrains both individual career development and aggregate labour supply, it reflects a rational response to a distorted housing system.
Policy Recommendations
This paper has documented trends in homeownership and housing affordability in Hong Kong between 1985 and 2023. We find that the large expansion of subsidised ownership housing in the 1980s and 1990s coincided with a dramatic increase in homeownership and housing affordability, with major benefits to Hong Kong’s post-war baby boomer generation. However, Hong Kong retreated from the construction of subsidised ownership housing beginning in 2002. Correspondingly, housing assistance and homeownership of recent birth cohorts are much lower than previous generations. Today, Hong Kong’s youth face impossibly unaffordable rents and prices, leaving means-tested public rental housing as the only affordable option. This housing situation has demoralising impacts on the population’s enterprise and upward mobility.
Below are three specific policy changes that we recommend.
1. Increase production of higher-quality public ownership units
The current Long-term Housing Strategy, established in 2014, plans housing supply targets by counting the number of housing units demanded by the population, according to projected population growth and housing reconstruction. Since this methodology does not account for unit quality, it biases Hong Kong toward supplying small units. The result is that the housing supply has not been able to meet the needs of Hong Kong’s high-income population, which requires much more than a basic minimum quality of housing.
Hong Kong’s persistent undersupply of higher-quality housing and deepening affordability problems is a direct consequence of the current flawed planning methodology. Given this methodology, it is unsurprising that average new unit size has declined in recent years. Although Hong Kong has somewhat increased its housing supply targets in recent years, these increases are small. They also focus excessively on building small public rental housing units rather than higher-quality subsidised homes. As such, the current policy fails to help younger households above the PRH limit to afford units that are of higher quality than PRH units.
We recommend substantially increasing the supply of higher-quality ownership housing. Doing so is revenue-positive and fiscally prudent, since subsidised ownership housing can be sold to eligible households for substantially more than their construction cost. It will also help to meet rising residential demand and help attract talent and investment to the city.
2. Remove restrictions on the circulation of subsidised sale flats
In addition to increasing the supply of subsidised sale flats (SSF), we recommend relaxing the restrictions on circulation within the existing public housing stock. Currently, restrictions on resale and leasing limit the circulation of subsidised sale flats. For example, the transactions in the HOS Secondary Market (HOSSM) are restricted by quotas. In 2024, the estimated average wait time for White Form applicants applying each year to obtain permission to purchase second-hand units isaround 5.7 years.[4] Another example is a pilot scheme that allows SSF owners to lease their units to White Form applicants. However, this scheme is subject to a quota of 3,000. These resale and leasing restrictions limit opportunities for existing owners to trade up and for non-owners to move onto the housing ladder.
Given such restrictions, it is natural that public ownership units have low turnover. In 2024, there were more than 454,000 subsidised ownership units, yet there were only 4,435 transactions in the secondary market, representing circulation of just 1% of units. This rate is less than half that of the private secondary market (2.2%) and only one-seventh of the private market average between 2004-2010. Residential mobility in public ownership housing is also much lower than similar private housing (Lui and Suen 2011). In other words, public owners are prevented from upgrading to larger flats, while those outside the public system are unable to climb the housing ladder by purchasing or renting second-hand subsidised flats.
In the 2025 Policy Address, the Government adopted several measures to relax leasing and resale restrictions. These measures are encouraging, but they do not as yet go far enough (Wong, Ngau and Sung 2025). We recommend further relaxing leasing and resale restrictions on the circulation of subsidised sale flats. Doing so can increase access to housing and improve the chances for youth to move up the housing ladder.
3. Adopt housing price and affordability targets, instead of supply targets, and use more responsive mechanisms to determine housing supply
Although we recommend substantially increasing housing supply beyond current production targets, an expansion of the housing stock may dampen real estate prices. This concern is especially important, since integration with the Mainland and higher US interest rates put downward pressure on real estate prices.
We recommend that Hong Kong establish housing price and affordability targets, rather than supply targets, and use dynamic mechanisms for balancing housing demand and supply. Singapore’s “build-to-order” model—where public housing construction proceeds only after sufficient eligible households place confirmed orders—is an example of a more dynamic and responsive approach that can prevent large swings in prices and affordability. Compared to Hong Kong’s current methodology of directly estimating housing demand based on rudimentary population and building statistics, a more responsive mechanism will be much better at ensuring price stability in both periods of high demand and those of low demand.
References
Baum-Snow, Nathaniel. 2023. “Constraints on City and Neighborhood Growth: The Central Role of Housing Supply.” Journal of Economic Perspectives 37 (2): 53–74.
Cox, Wendell. 2025. “Demographia International Housing Affordability: 2025 Edition.” Chapman University Center for Demographics & Policy.
Dustmann, C., Fitzenberger, B. & Zimmermann, M. 2022. “Housing Expenditure and Income Inequality.” The Economic Journal, Vol. 132, No. 645, p. 1709-1736.
Glaeser, Edward, and Joseph Gyourko. 2018. “The Economic Implications of Housing Supply.” Journal of Economic Perspectives 32 (1): 3–30.
Hsieh, Chang-Tai, and Enrico Moretti. 2019. “Housing Constraints and Spatial Misallocation.” American Economic Journal: Macroeconomics 11 (2): 1–39.
Lui, Hon-Kwong & Suen, Wing. (2011). “The effects of public housing on internal mobility in Hong Kong.” Journal of Housing Economics. 20. 15-29.
UN-Habitat, “The global housing affordability challenge: a more comprehensive understanding of the housing sector.” Urban Data Digest, version 2, May 2019. 4-6.
Wong, Michael B., Ngau, Chi-Hang and Sung, Yun-Wing. (2025). “施政報告扶助置業方向正確 惜力度不足.” Ming Pao.
[1] The White Form lottery winning probability was 12%, so if a household entered the lottery once every year, on average they would have to wait 1/0.12 = 8.3 years.
[2] The White Form lottery winning probability was 28%, so if a household entered the lottery once every year, on average they would have to wait 1/0.28 = 3.6 years.
[3] The White Form lottery winning probability was 4%, so if a household entered the lottery once every year, on average they would have to wait 1/0.04 = 25 years.
[4] The HOSSM lottery winning probability was 17.65%, so if a household entered the lottery once every year, on average they would have to wait 1/0.1765 = 5.67 years.