Professor Heiwai Tang and Ms Yang Chen
30 April 2025
After seven years of negotiation, the world’s largest free-trade agreement―the Regional Comprehensive Economic Partnership (RCEP)—officially took effect on 1 January 2022, covering close to 30% of the world’s population and accounting for over one-third of the global GDP. Amid intensifying global economic fragmentation, the RCEP carries high expectations. By encompassing both large and small Asia-Pacific countries with different systems, the agreement demonstrates great potential and resilience for inclusive regional cooperation.
What impacts has the RCEP had on the Asia-Pacific trade landscape since its implementation three years ago? How will it reshape the patterns of trade among its members? Based on the RCEP Trade Tracker developed by HKU Asia Global Institute (see Note), this article provides a comparative analysis of trade performance among RCEP economies between the first quarter of 2020 and the third quarter of 2024. The findings demonstrate the following four prevailing trends shaping trade dynamics under the agreement.
- China remains the dominant exporter within the region, but its trade growth has clearly slowed down. While its exports to RCEP partners experienced a modest recovery in 2024 after a decline the previous year, the overall momentum has weakened.
- In pursuit of a deliberate trade diversification strategy, Japan has strengthened ties with Vietnam, Malaysia, etc. while effectively reducing reliance on China. Its overall trade within the RCEP framework saw a marginal contraction in 2024.
- After a downturn in 2023, intra-ASEAN trade recorded a strong rebound by 7% in 2024, reflecting deepening regional economic integration and providing member nations with a fresh growth impetus.
- RCEP economies are increasingly trading with non-member countries. In 2024, this trade expanded by 5% to reach US$3.4 trillion, surpassing intra-RCEP trade growth for the first time.
Trend 1: Mild growth of China’s trade with RCEP
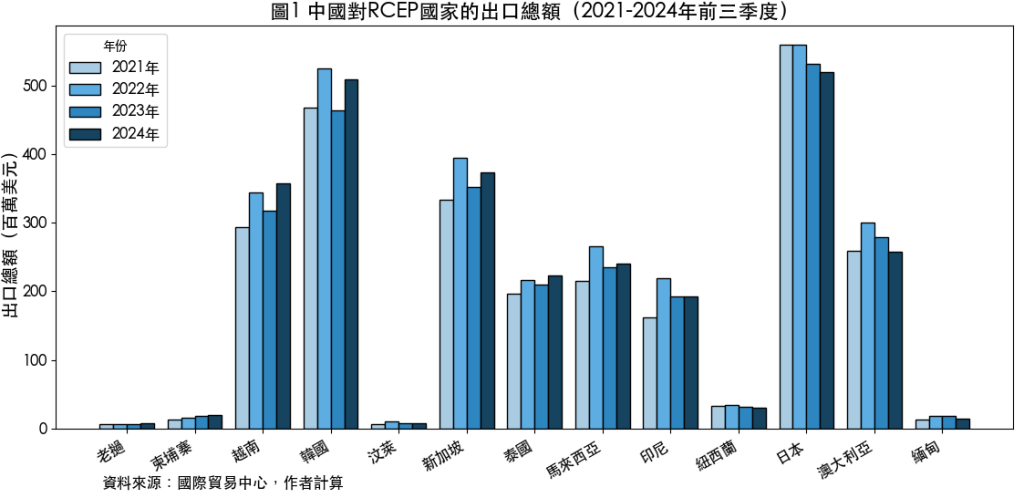
As a core RCEP member, China has been playing a prominent role in regional trade. In the first three quarters of 2024, its exports to RCEP nations totalled US$2.76 billion. The 3.6% year-on-year increase marks a cautious recovery following an 8.5% downturn in 2023. This modest rebound suggests that China’s trade within the region has entered a phase of steady growth.
In the wake of the coronavirus pandemic, China’s exports to the RCEP bloc surged by an impressive 24.9% in 2021, followed by continued strong growth in 2022. However, Chinese exports to the RCEP bloc contracted for the first time by 8.5% in 2023, as a result of global supply chain restructuring and intense competition from ASEAN manufacturing industries.
The uptick in 2024 was accompanied by a significant change in market structure. On the one hand, China’s exports to Japan have fallen for two consecutive years (by 1.9% in 2024 and 5.1% in 2023), indicating that Japan is actively diversifying its supply chains and gradually reducing dependency on China. On the other hand, the performance of the Vietnamese market stood out. China’s exports to this market rose by 12.7%, reversing the 7.5% decline in 2023. This demonstrates Vietnam’s escalating status in the global supply chains.
Within the ASEAN region, China’s trade performance varied. Laos, Cambodia, and Vietnam recorded the fastest annual growth of 17.7%, 14.6%, and 12.7% respectively for Chinese exports. This underscores the rising economic vibrancy of the Indo-Chinese countries. In comparison, the relatively mature markets such as Singapore and Thailand maintained stable growth at around 6%, while Indonesia registered a slight growth of 0.3%. China’s exports to Australia and Myanmar shrank by 7.5% and 17.6% respectively, due to weaker demand triggered by domestic factors in both countries.
Particularly noteworthy is that China’s exports to South Korea showed a remarkable recovery in 2024, incrementing by 9.6%, mainly thanks to renewed demand for electronic components and industrial equipment. This change not only hinges on a resurgence of manufacturing in South Korea, but also testifies to the positive effect of RCEP tariff concessions on high-tech supply chains.
On the whole, while China remains the largest trade hub within the RCEP, intra-bloc trade flows have diversified. This shift is simultaneously driven by members’ industrial upgrading and supply chain adjustments, as well as the deepening progress in regional economic integration under the RCEP agreement.
Trade ties between China and RCEP partners have entered a new phase. On the one hand, with its comprehensive industrial system and scale advantages, China will continue to serve as the key supplier of mechanical equipment and electronic products. On the other hand, by upgrading their manufacturing capabilities and signing diversified trade agreements, the ASEAN countries gradually reduce overdependence on a single market. Such a state of dynamic equilibrium is expected to continue reshaping the future trade map of the RCEP region.

Trend 2: Gradual stabilization of Japan’s trade with RCEP after pandemic volatility
From 2020 onwards, Japan’s trade relations with RCEP countries have been characterized by fluctuating patterns of both substantial ups and downs. Despite a remarkable 23.2% growth in its exports to RCEP nations in 2021, the momentum soon faded. Japan’s total exports to the region plunged by 13.3% in 2023 and further dropped by 3.5% in 2024, reflecting a persistent cooling of regional demand.
One of the most striking shifts is Japan’s evolving relationship with ASEAN markets. The Vietnamese and Malaysian markets are fairly resilient, with Japan’s exports to these two markets expanding steadily, in contrast to the sharp declines of 11.8% and 12.9% to Thailand and Indonesia respectively. Japan’s trade with the Philippines, after a staggering 19.1% contraction in 2023, experienced a diminished decline to 2.6% in 2024, showing initial signs of stabilization.
These diversification trends align with Japan’s strategic adjustments to its supply chains, prioritizing Vietnam and Malaysia as important bases because of their prosperous manufacturing sectors, lower production costs, and active participation in strategic trade pacts, such as the Comprehensive and Progressive Agreement for Trans-Pacific Partnership (CPTPP) and the RCEP, in support of Japan’s China+1 strategy for supply chain diversification. In contrast, owing to higher production costs, political uncertainties, and slower economic recovery, Thailand and Indonesia are notably less competitive among Japanese export markets.
Clearly evident is Japan’s progressive disengagement from the Chinese market. In 2020, China was Japan’s primary trading partner within the region, representing 48% of Japan’s total RCEP-bound exports. This percentage slipped to 41.7% in 2023 but slightly rebounded to 42.8% in 2024, illustrating China’s indispensable role and the structural constraints Japan faces in its endeavours to redirect trade dynamics.
Trend 3: Intra-ASEAN trade growth outpacing RCEP bloc
Intra-ASEAN trade showed strong growth in 2021 and 2022, followed by an unforeseen contraction of 13.3% in 2023 but a modest recovery of 7.03% in 2024. These volatilities suggest that, in addition to facing external impacts including a slowdown in global trade and supply chain disruptions, some ASEAN economies were also subject to the structural problem of weak domestic demand.
Nevertheless, intra-ASEAN trade performed better than intra-RCEP trade. In 2022, intra-ASEAN trade growth even doubled that of the RCEP economies (see Figure), highlighting deepening regional economic integration within the ASEAN. Despite experiencing a downturn similar to intra-RCEP trade in 2023, intra-ASEAN trade recorded a pronounced rebound of 7.03% in 2024, demonstrating the ASEAN’s strengthening resistance to external impacts.
Trade performance varied across ASEAN members. Vietnam’s exports to the ASEAN region leapt by 23.6% and 26.2% in 2021 and 2022 respectively, resulting in an accumulated rise of over 50%. This achievement secured the country’s position as a key node in ASEAN’s supply chains. Despite a fall of 7.63% in 2023, Vietnam’s exports to other ASEAN nations rebounded with 3.92% growth in 2024, suggesting its trade network’s gradual adaptation to the new normal.
As for Indonesia, Malaysia, and Singapore, their trade performance was highly volatile. After surging by 21.2% and 39.6% in 2021 and 2022 respectively, trade among these countries saw a sharp decline of 18.6% in 2023, followed by an additional 8% drop in 2024. The downturn for two consecutive years implies that this trilateral trade may be facing structural challenges. In contrast, Thailand demonstrated stronger adaptability. After peaking at US$54.8 billion in 2022, Thailand’s intra-ASEAN exports declined by 10.3% in 2023 but rebounded with a 5.5% growth in 2024. This illustrates a recovery in demand for Thai exports, driven by a resurgence in investment and production activities within ASEAN.

Trend 4: RCEP deepening trade ties with non-members
Trade between RCEP members and non-member nations has exhibited a dynamic trajectory, reaching a total trade value of US$3.37 trillion in the first three quarters of 2024, representing a 5% increase over 2023. The most unprecedented expansion occurred in 2021, when trade shot up by nearly 30% (spurred by post-pandemic recovery and robust demand worldwide). Despite a temporary contraction of 7% from global economic downturn pressures in 2023, a rapid rebound in 2024 underscores the adaptability and resilience of the RCEP economies as they continued to strengthen their global trade networks.
South Korea has been a leading force in this expansion, with its exports to non-RCEP partners climbing to US$289 billion in 2024, marking a year-on-year growth of 12.8%. An extraordinary 30.62% jump in its exports to non-RCEP partners in 2021 signalled South Korea’s vitality and resilience, derived from its deep integration into the international market.
Indonesia’s journey, however, has been more turbulent. After skyrocketing by 33.68% and 35.1% in 2021 and 2022 respectively, its exports plummeted by 16.01% in 2023, reflecting multiple challenges, including weaker global demand, supply chain disruptions, and shifts in trade policies. While 2024 saw a minor increase of 3.14% in exports, the country’s pace of recovery clearly lagged behind that of other major economies in the region.
Overall, while intra-RCEP trade remains a vital driver of economic integration, member nations are actively diversifying their partnerships beyond the bloc, generating a vigorous export-oriented momentum. The RCEP is gradually transitioning from a regional economic growth engine to a pivotal force in reshaping the global trade landscape.
Note: https://www.asiaglobalinstitute.hku.hk/rcep-trade-tracker


