Seven Indicators Forecast Great Challenges for Hong Kong’s Economy
Dr Chi-pui Ho and Dr Cynthia Cao
21 August 2024
In my previous article in this column last month, I point out from the start that utilizing economic time series, clear diagrams and tables, coupled with relevant theories, is conducive to providing a full picture of local economic development (see 【Note】). In this article, I will analyse the overall performance in the following seven categories: logistics and transport, gross domestic product (GDP), prices, labour market, industrial sectors, demographic structure, and economic outlook indicators. Future challenges in each category will be presented, with data illustrated by charts.
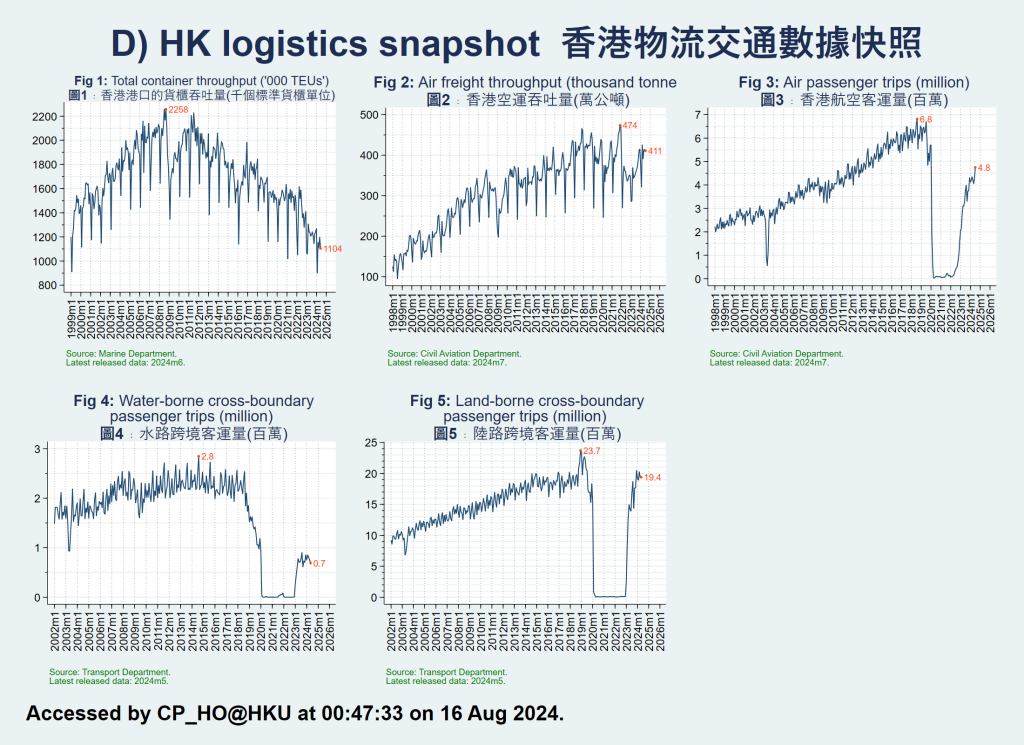
Falling container throughput and surging land transport

With its strategic location, deep natural harbour, and well-established container transport facilities, Hong Kong has developed into one of the busiest ports in the world and a major entrepot in Asia. At the turn of the 21st century, the “front shop, back plant” model boosted transhipments from the Pearl River Delta Economic Zone through Hong Kong to overseas markets, spurring the growth of its container throughput. Since the 2010s, however, significant development of Mainland ports has reduced the need for transhipment of goods through Hong Kong to Mainland cities, thus gradually decreasing its sea freight throughput (see Figure D1).
In terms of air traffic, Hong Kong boasts wide-ranging geographical advantages. Coupled with an expansive air transport network and a premier international airport, these factors have enabled it to become a primary air freight hub in the region. Leveraging the “front shop, back plant” model of the neighbouring Pearl River Delta Economic Zone, the city’s air freight throughput has recorded an upward trend. That said, in recent years, facing competition from airports (particularly those in the Mainland), Hong Kong International Airport must enhance operational efficiency, optimize cargo facilities, and adopt state-of-the-art technologies, and strengthen connectivity in order to maintain its status as a dominant aviation hub.
As for passenger traffic, Hong Kong, being an international metropolis, relies heavily on air travel to connect with the rest of the world. The importance of this is reflected in the remarkable growth over the years. However, in the wake of the COVID-19 pandemic, air passenger volume has yet to return to pre-pandemic levels.
Surrounded by water on three sides, Hong Kong has a widespread maritime network that facilitates connections with nearby regions. This has historically expedited the increase in cross-border waterborne transport in the past, especially at the Hong Kong-Macau Ferry Terminal. Since the opening of the Hong Kong-Zhuhai-Macao Bridge in 2018, Hong Kong has registered a slowdown in cross-border sea passenger throughput, which has remained at low levels after the pandemic.
Land infrastructures such as the Shenzhen Bay Bridge, the Guangzhou-Shenzhen-Hong Kong Express Rail link, and the Hong Kong-Zhuhai-Macao Bridge have facilitated land links between Hong Kong and the Chinese Mainland. The number of cross-border passengers has continued to rise since the beginning of this century and has quickly rebounded after the coronavirus pandemic.
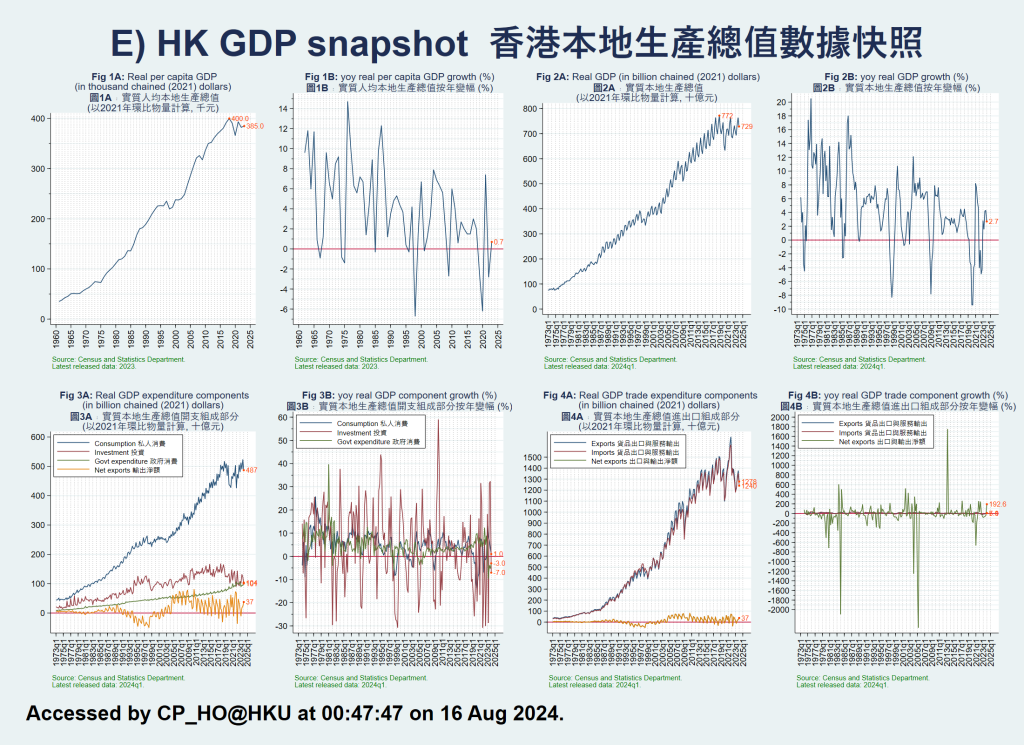
Stable economic growth and low inflation

Productivity, a robust labour force, and a business-friendly environment have sustained the long-term growth of GDP per capita For decades (see Figure E1A), placing Hong Kong among the cities with the highest living standards worldwide. Since 1997, Hong Kong’s GDP per capita has climbed by an average of around 2% each year. Similarly, private consumption as well as imports and exports have shown comparable growth trends.

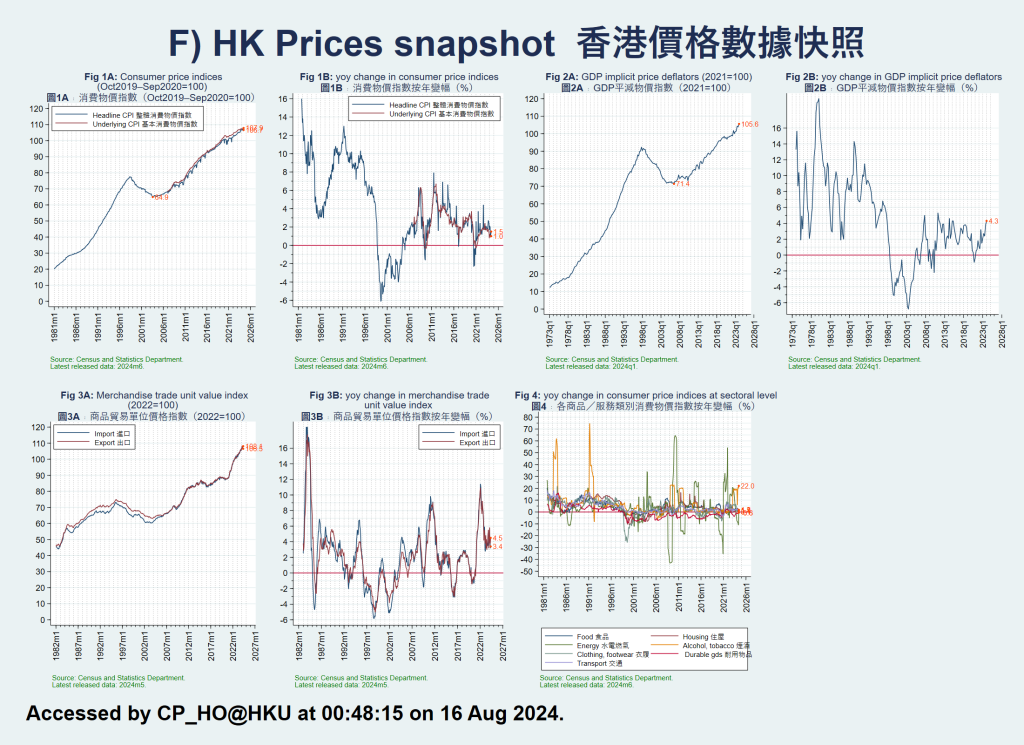
Under the linked exchange rate system, the Hong Kong dollar is pegged to the greenback and has benefited from the prudent US monetary policy. Consequently, Hong Kong’s inflation rate has remained low and stable. Since 2010, the overall Consumer Price Index has expanded by an average of 0.2% on a monthly basis. Expenses on housing, food, transport, water, and electricity are the main contributors to the overall Consumer Price Index (see Figure F1A).

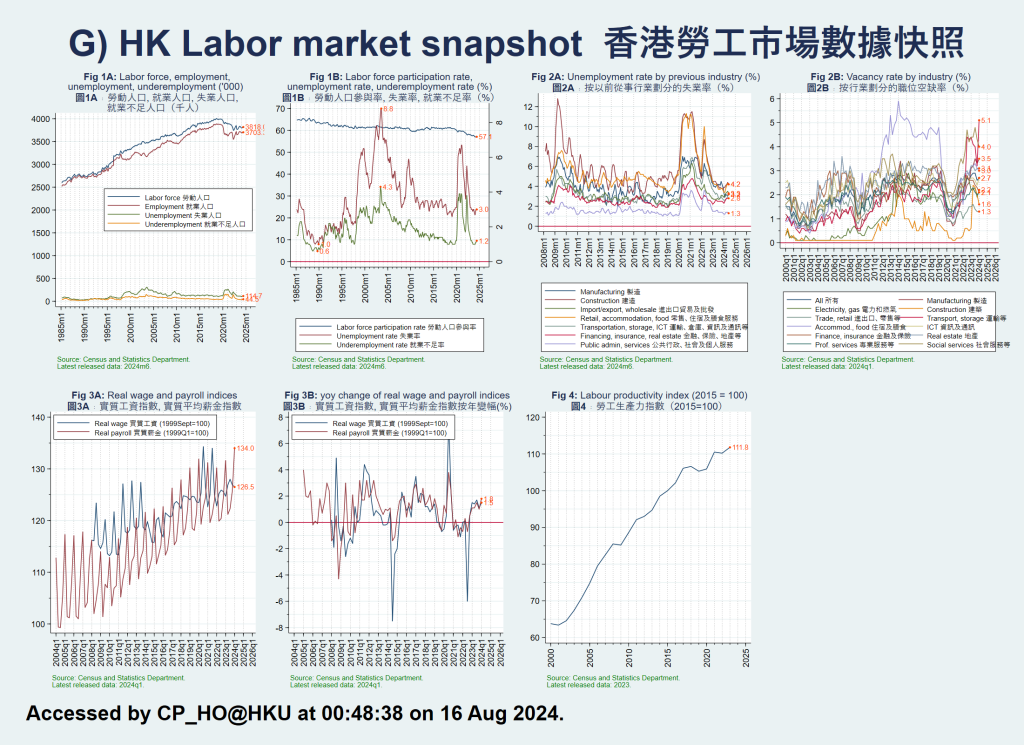
Since the 1980s, the focus of Hong Kong’s economic development has shifted from manufacturing to finance, logistics, and professional services, spelling the downward spiral of various traditional industries. The local labour market now demands a more educated workforce with new skills.
Thanks to economic stability in the 2010s, unemployment and underemployment remained at 3% to 4% and 1% to 2% respectively while population ageing led to a decline in labour force participation rate (see Figure G1B). The rise in wages has been lower than the economic growth in Hong Kong. From 1999 to the present, the real wage indices and the real payroll indices have risen by only around 30% whereas the real GDP has soared by around 100%.
In light of the above trends, Hong Kong needs to find solutions to the labour shortage caused by an ageing population and the income inequality resulting from stagnant wage growth. A series of labour welfare-related issues will also pose immense challenges to the labour market.
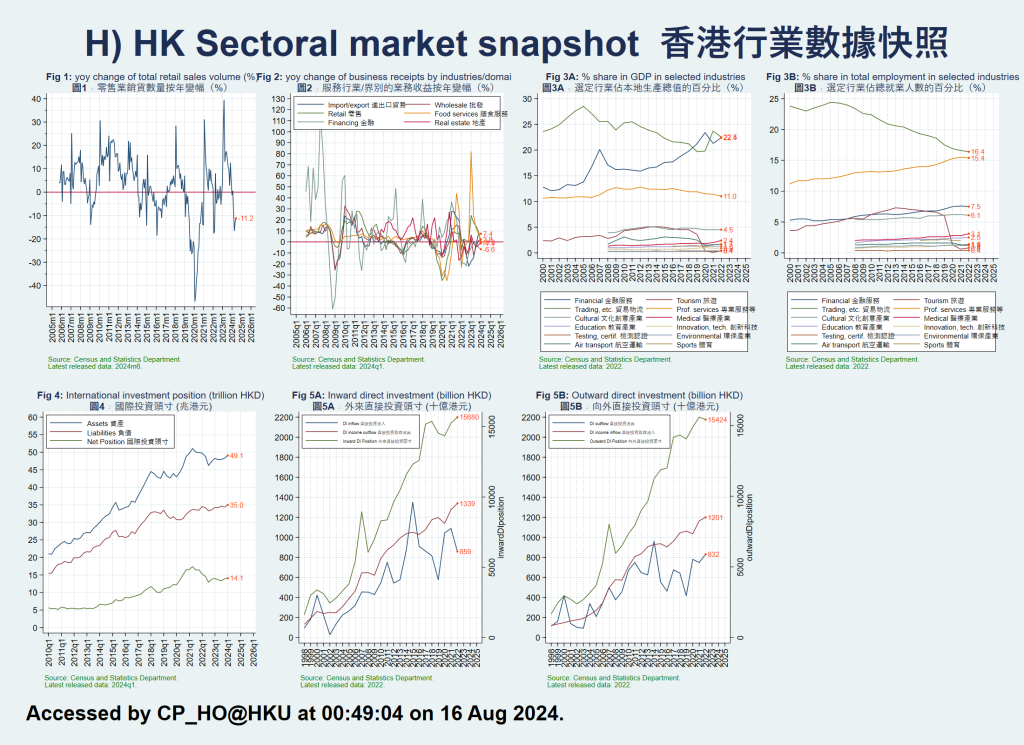
Plummeting share of the tourism industry

The four pillar industries of Hong Kong are financial services, tourism, trading and logistics, as well as professional and producer services. Professional and producer services encompasses a wide range of industries, including law, accounting, information technology, advertising, engineering, architectural design, and surveying services.
Since the 2010s, financial services has played a steadily important role in terms of contributions to GDP. In contrast, the significance of trade and logistics has experienced a downward trend. Severely disrupted by the coronavirus pandemic, tourism’s share of GDP has plunged from 5% pre-pandemic to less than 1% in recent years (see Figure H3A).
As for other sectors, the cultural and creative industries have shown exciting development, maintaining a share of GDP at around 5%. Medical services, education services, innovation and technology, testing and certification services, environmental industries, air transport, as well as sports and related activities have each seen their share of GDP hovering below 5%.

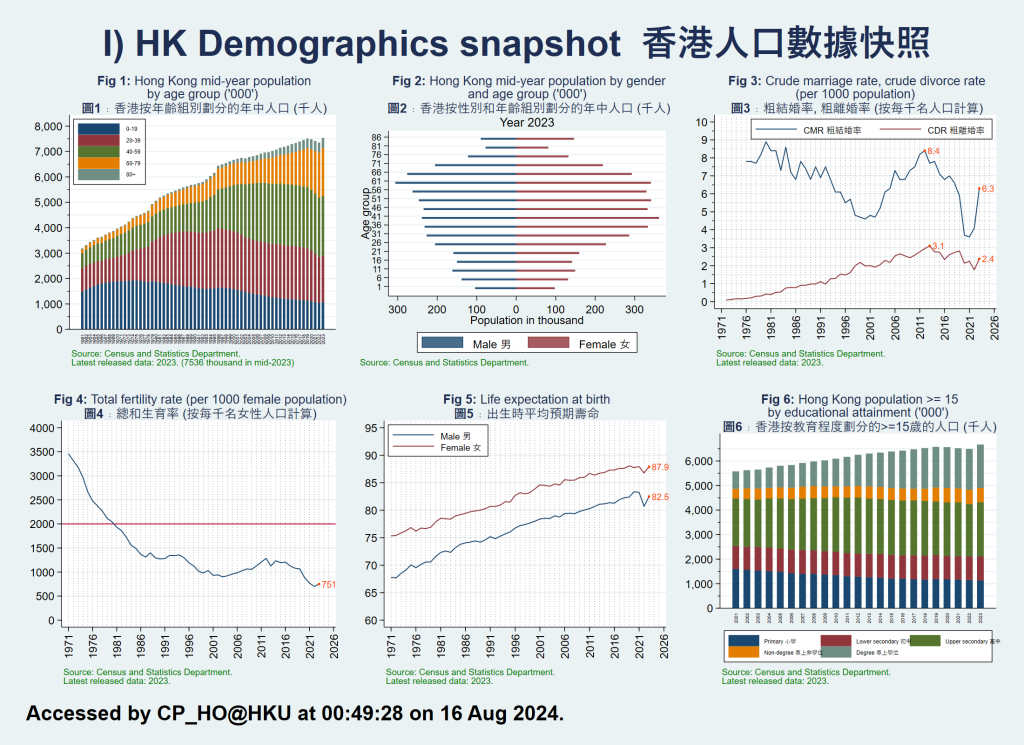
The local population continues to rise steadily and has now reached over 7.5 million. As an international financial centre, Hong Kong has been attracting talent from all over the world to work and live here.
Hong Kong prides itself on being one of the global cities with the highest average life expectancy. With ever-improving healthcare services and standards of living, the average life expectancy of Hongkongers is 85 years. Owing to a declining birth rate and higher life expectancy, the local population has been speedily ageing (see Figure I1). On the other hand, Hong Kong’s overall education level has been progressively rising.
Regarding marriage and divorce rates, with changes in social norms, expanded educational and employment opportunities for women, and a rise in the age at first marriage, marriage rates have shown a declining trend since the 1970s. In comparison, divorce rates have accelerated, indicating a change in attitudes toward and acceptance of divorce in society. Meanwhile, as a result of the upward cost of living, work pressure, changing family expectations, etc., Hong Kong’s birth rate has markedly declined from 3.5 children per woman in the 1970s to 0.75 children per woman in 2023, far below the replacement level.
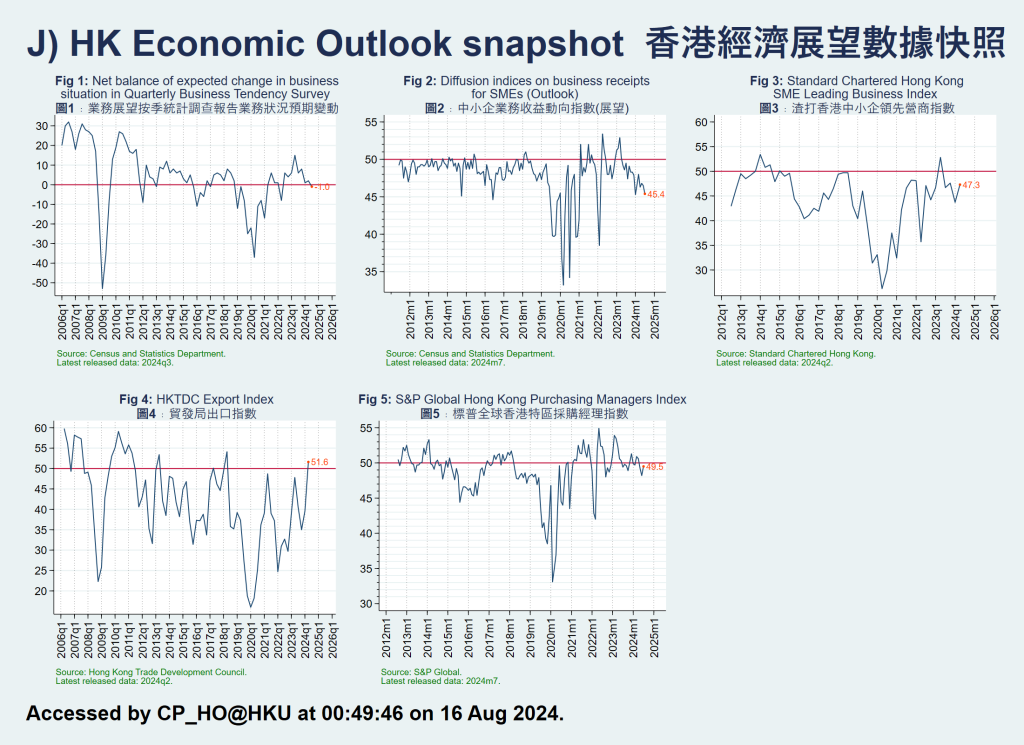
Business indices signal caution

When it comes to future economic growth, large institutions regularly release an array of indicators for different sectors to reference, including the following five that track Hong Kong’s economic development.
The “Report on Quarterly Business Tendency Survey”, conducted by the Hong Kong SAR Government’s Census and Statistics Department, presents the business confidence and expectations of companies in various sectors. Positive signs indicate overall bright prospects while negative signs indicate overall bleak prospects.
The Census and Statistics Department also publishes the “Report on Monthly Survey on the Business Situation of Small and Medium-sized Enterprises”, which presents diffusion indices on business receipts of these enterprises by comparing their expectations of their business situation in the coming month with the current situation. A reading above 50 indicates that the business condition is generally favourable while a reading below 50 reflects the opposite.
The “Standard Chartered Hong Kong SME Leading Business Index” is undertaken independently by the Hong Kong Productivity Council. As a composite index to gauge the performance of SMEs in Hong Kong, its calculations are based on different economic indicators with a weighted average. These indicators encompass retail sales value, industrial production index, and export volume.
An upward trend in the composite index indicates improving economic performance of SMEs. In contrast, a falling trend suggests that their economic performance is under pressure, pointing to an economic downturn or a business environment facing unfavourable factors.
The “Hong Kong Trade Development Council’s Export Index” assesses the sentiments and expectations among Hong Kong exporters. When the index is higher than 50, it reflects an overall optimistic outlook on exports. Conversely, when it is lower than 50, it indicates an overall pessimistic outlook.
The “S&P Global Purchasing Managers’ Index of Hong Kong”, based on surveys of purchasing managers across various industries, reflects economic performance through new orders, employment, and output. When the index is higher than 50, it indicates expanding economic activity. When it is lower than 50, it indicates economic contraction.
All in all, in recent years, companies across various industries in Hong Kong have been cautious about the business environment and export outlook. This highlights the multiple geopolitical challenges ahead, the changing consumption patterns of Mainland tourists, and the mounting competition from neighbouring regions.
【Note】: Ho, Chi-pui, “Analysing Hong Kong’s Property Market with Data”, 17 July 2024; “Analysing Hong Kong’s Financial and Tourism Markets with Data”, 18 July 2024; Hong Kong Economic Journal